
???????????????????????????pylot??-python
???????????? ???????[ 2013/5/20 10:02:14 ] ????????
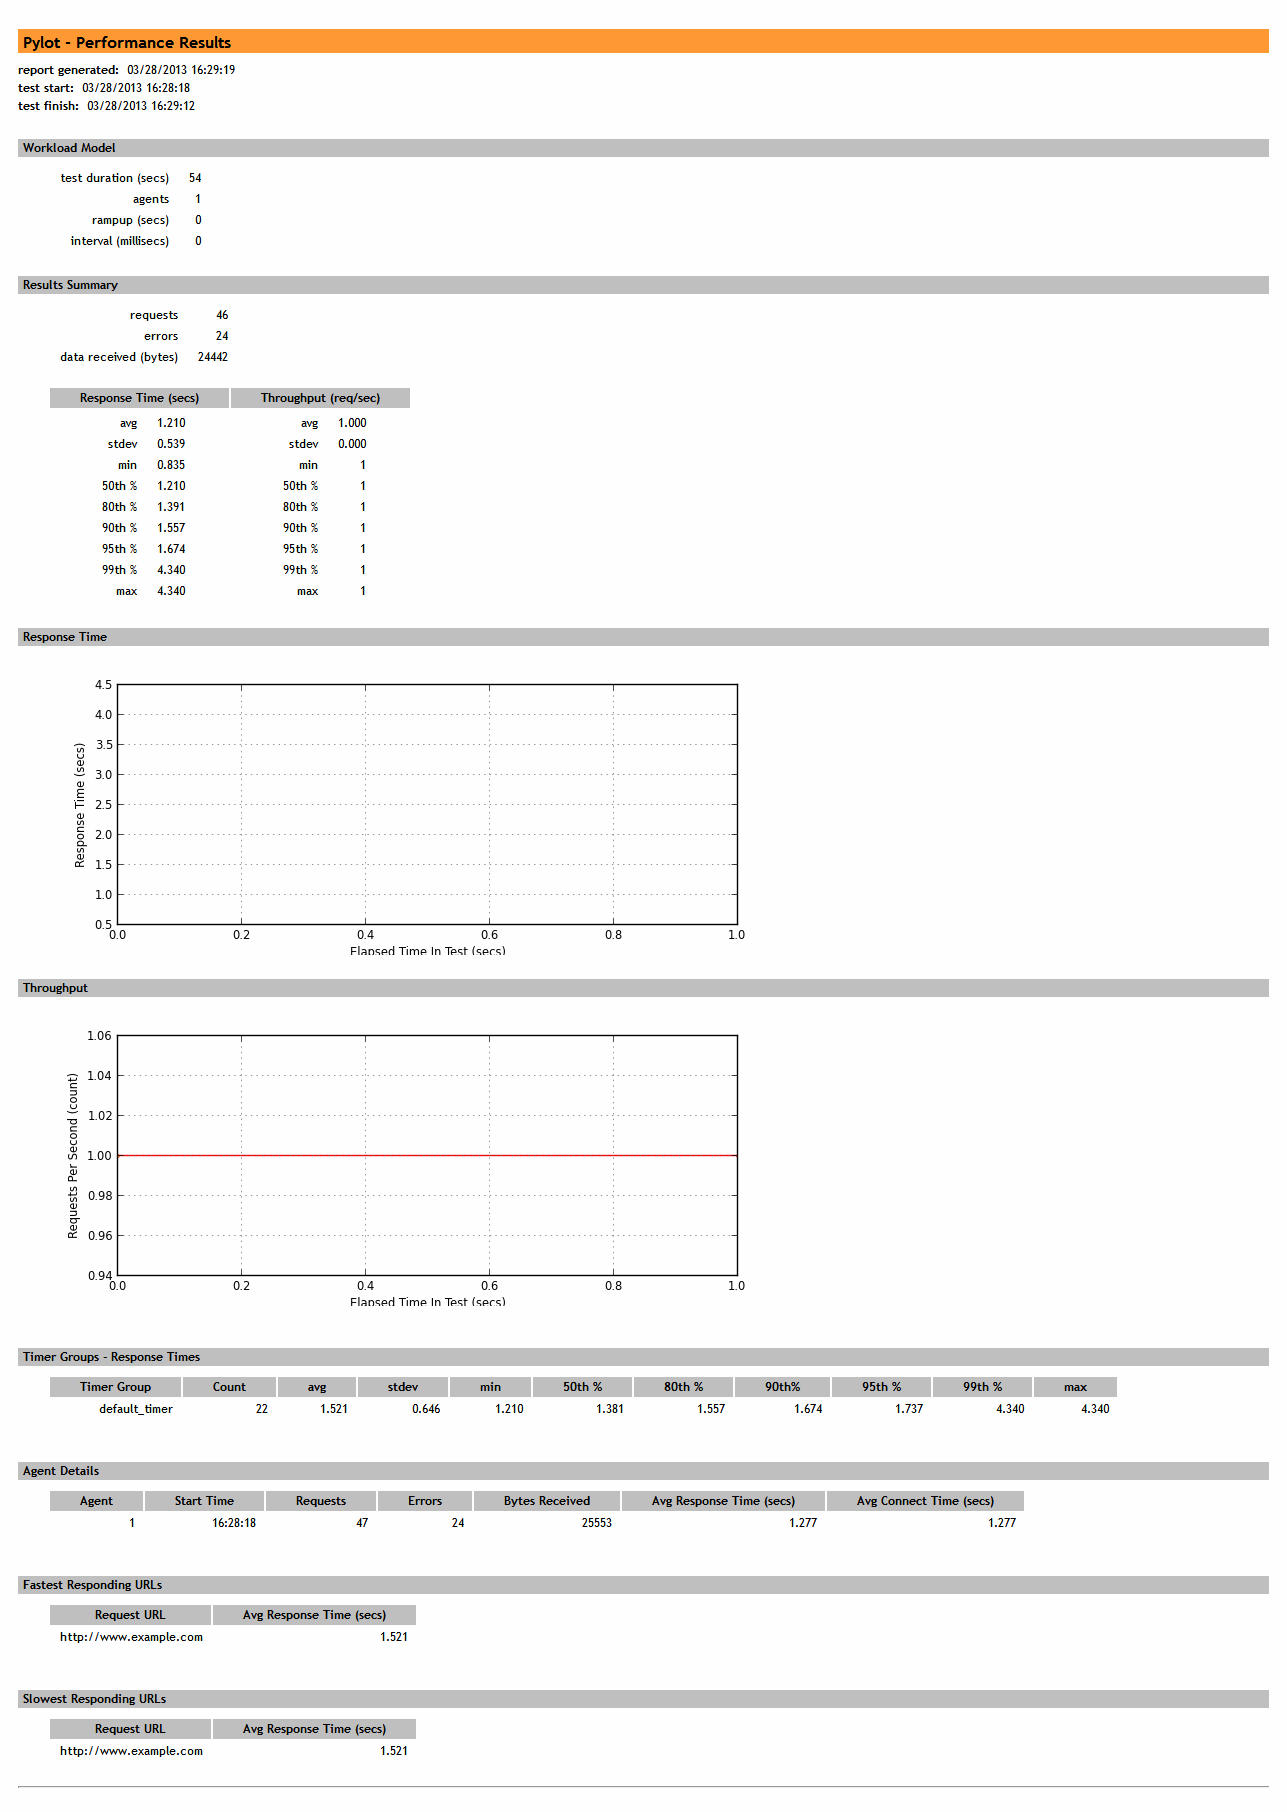
????5?????????????
?????????л??????????д?????csv????У????????????к??????????????????????????????????????????????python???????????matlibplot???????????д??html?????????????
???????????
def generate_results(dir?? test_name):
print '
Generating Results...'
try:
merged_log = open(dir + '/agent_stats.csv'?? 'rb').readlines() # this log contains commingled results from all agents
except IOError:
sys.stderr.write('ERROR: Can not find your results log file
')
merged_error_log = merge_error_files(dir)
if len(merged_log) == 0:
fh = open(dir + '/results.html'?? 'w')
fh.write(r'<html><body><p>None of the agents finished successfully. There is no data to report.</p></body></html>
')
fh.close()
sys.stdout.write('ERROR: None of the agents finished successfully. There is no data to report.
')
return
timings = list_timings(merged_log)
best_times?? worst_times = best_and_worst_requests(merged_log)
timer_group_stats = get_timer_groups(merged_log)
timing_secs = [int(x[0]) for x in timings] # grab just the secs (rounded-down)
throughputs = calc_throughputs(timing_secs) # dict of secs and throughputs
throughput_stats = corestats.Stats(throughputs.values())
resp_data_set = [x[1] for x in timings] # grab just the timings
response_stats = corestats.Stats(resp_data_set)
# calc the stats and load up a dictionary with the results
stats_dict = get_stats(response_stats?? throughput_stats)
# get the pickled stats dictionaries we saved
runtime_stats_dict?? workload_dict = load_dat_detail(dir)
# get the summary stats and load up a dictionary with the results
summary_dict = {}
summary_dict['cur_time'] = time.strftime('%m/%d/%Y %H:%M:%S'?? time.localtime())
summary_dict['duration'] = int(timings[-1][0] - timings[0][0]) + 1 # add 1 to round up
summary_dict['num_agents'] = workload_dict['num_agents']
summary_dict['req_count'] = len(timing_secs)
summary_dict['err_count'] = len(merged_error_log)
summary_dict['bytes_received'] = calc_bytes(merged_log)
# write html report
fh = open(dir + '/results.html'?? 'w')
reportwriter.write_head_html(fh)
reportwriter.write_starting_content(fh?? test_name)
reportwriter.write_summary_results(fh?? summary_dict?? workload_dict)
reportwriter.write_stats_tables(fh?? stats_dict)
reportwriter.write_images(fh)
reportwriter.write_timer_group_stats(fh?? timer_group_stats)
reportwriter.write_agent_detail_table(fh?? runtime_stats_dict)
reportwriter.write_best_worst_requests(fh?? best_times?? worst_times)
reportwriter.write_closing_html(fh)
fh.close()
# response time graph
def resp_graph(nested_resp_list?? dir='./'):
fig = figure(figsize=(8?? 3)) # image dimensions
ax = fig.add_subplot(111)
ax.set_xlabel('Elapsed Time In Test (secs)'?? size='x-small')
ax.set_ylabel('Response Time (secs)' ?? size='x-small')
ax.grid(True?? color='#666666')
xticks(size='x-small')
yticks(size='x-small')
axis(xmin=0)
x_seq = [item[0] for item in nested_resp_list]
y_seq = [item[1] for item in nested_resp_list]
ax.plot(x_seq?? y_seq??
color='blue'?? linestyle='-'?? linewidth=1.0?? marker='o'??
markeredgecolor='blue'?? markerfacecolor='yellow'?? markersize=2.0)
savefig(dir + 'response_time_graph.png')
# throughput graph
def tp_graph(throughputs_dict?? dir='./'):
fig = figure(figsize=(8?? 3)) # image dimensions
ax = fig.add_subplot(111)
ax.set_xlabel('Elapsed Time In Test (secs)'?? size='x-small')
ax.set_ylabel('Requests Per Second (count)' ?? size='x-small')
ax.grid(True?? color='#666666')
xticks(size='x-small')
yticks(size='x-small')
axis(xmin=0)
keys = throughputs_dict.keys()
keys.sort()
values = []
for key in keys:
values.append(throughputs_dict[key])
x_seq = keys
y_seq = values
ax.plot(x_seq?? y_seq??
color='red'?? linestyle='-'?? linewidth=1.0?? marker='o'??
markeredgecolor='red'?? markerfacecolor='yellow'?? markersize=2.0)
savefig(dir + 'throughput_graph.png') try: # graphing only works on systems with Matplotlib installed
print 'Generating Graphs...'
import graph
graph.resp_graph(timings?? dir=dir+'/')
graph.tp_graph(throughputs?? dir=dir+'/')
except:
sys.stderr.write('ERROR: Unable to generate graphs with Matplotlib
')
print '
Done generating results. You can view your test at:'
print '%s/results.html
' % dir
????????????????У???????????????????????????QA???GUI??????Pylot?????????GUI????????????????á??????????????GUI??????????pylot??????????????????????????????????п???????????pylot?е?????????????????????????????????????????????????????????????????????pylot???????????????????????
??????


???·???
??????????????????
2023/3/23 14:23:39???д?ò??????????
2023/3/22 16:17:39????????????????????Щ??
2022/6/14 16:14:27??????????????????????????
2021/10/18 15:37:44???????????????
2021/9/17 15:19:29???·???????·
2021/9/14 15:42:25?????????????
2021/5/28 17:25:47??????APP??????????
2021/5/8 17:01:11
 sales@spasvo.com